When Windows experiences a blue screen, if configured correctly, the system writes critical information about the kernel memory at the time of failure to a file called a dump file, typically with a .dmp extension.
This article explains how to use WinDbg to analyze the cause of system blue screens;
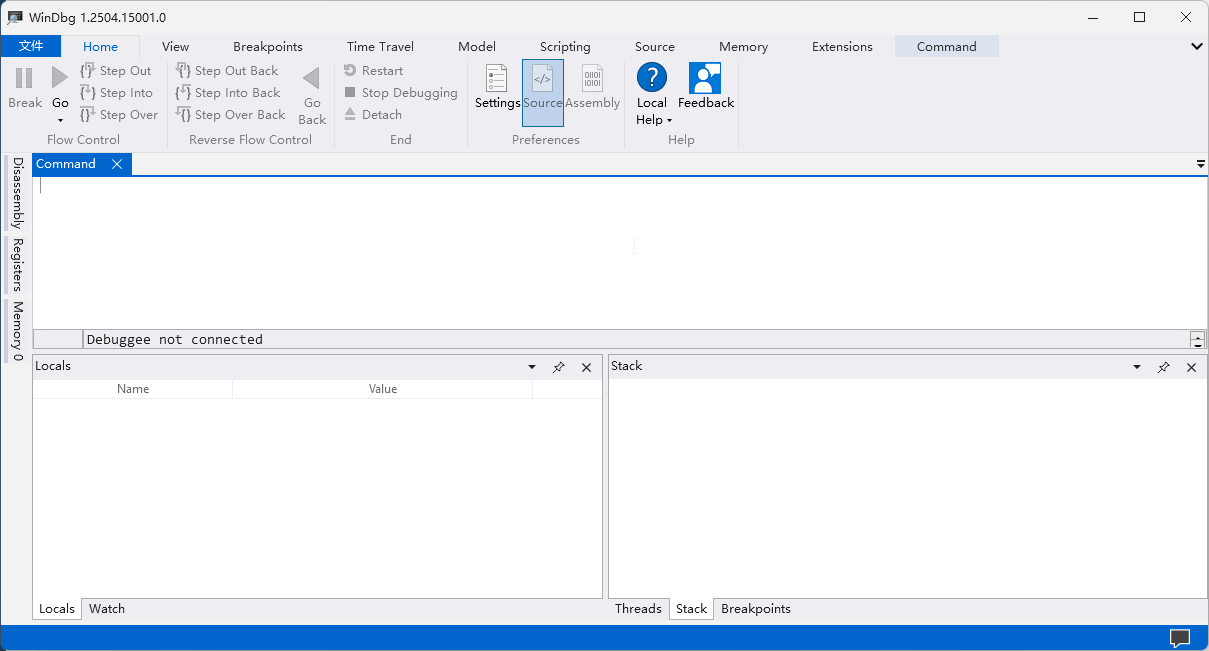
What is WinDbg
WinDbg is a powerful free debugger provided by Microsoft, used for analyzing crash dumps, debugging live user-mode and kernel-mode code, and examining CPU registers and memory.
When programs crash, systems blue screen, or exhibit abnormal behavior, developers use WinDbg to delve into the program's internals, examining memory, registers, and other core information to precisely identify the root cause of problems.
Installing WinDbg
Visit the official download link to get the WinDbg installer, then open the file and follow the prompts;
Or install WinDbg via Microsoft Store:
Or run the following command in command line to install:
winget install Microsoft.WinDbg
Analyzing Blue Screen Causes
1. Obtain the kernel dump file; methods can be found at:
It's best to copy the kernel dump file to another properly functioning computer for analysis to avoid potential blue screens during the process;
2. Install and run WinDbg;
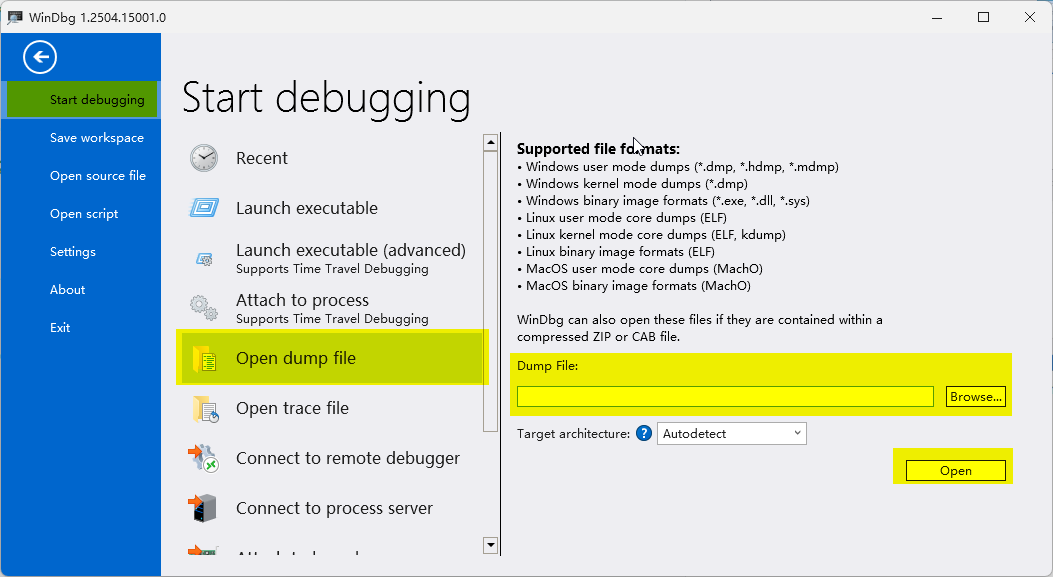
3. Navigate to [File] → [Start debugging] → [Open dump file], select the dump file to analyze, and click [Open];
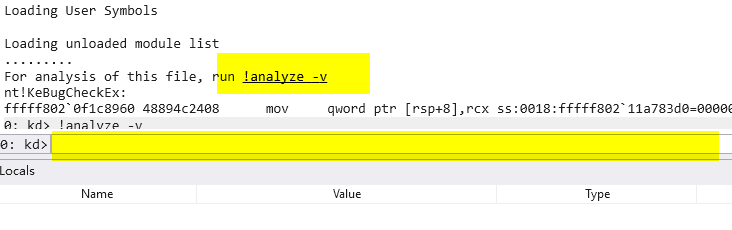
4. After opening the file, click !analyze -v or type !analyze -v in the input box and execute;
WinDbg will download symbol files - recommended to run in a networked environment;
With symbol files, the debugger can display clear function names;
After a moment, you'll see a detailed analysis report; due to space limitations, this example is incomplete and has been edited, explaining only key fields;
0: kd> !analyze -v
*******************************************************************************
*                                                                             *
*                        Bugcheck Analysis                                    *
*                                                                             *
*******************************************************************************

KMODE_EXCEPTION_NOT_HANDLED (1e)
This is a very common BugCheck.  Usually the exception address pinpoints
the driver/function that caused the problem.  Always note this address
as well as the link date of the driver/image that contains this address.
Arguments:
Arg1: ffffffffc0000005, The exception code that was not handled
Arg2: fffff8022506decf, The address that the exception occurred at
Arg3: 0000000000000001, Parameter 0 of the exception
Arg4: ffff8003d323b812, Parameter 1 of the exception
Here KMODE_EXCEPTION_NOT_HANDLED (1e) indicates the blue screen error code and name; 1e corresponds to 0x0000001e;
BUGCHECK_CODE:  1e
BUGCHECK_P1: ffffffffc0000005
BUGCHECK_P2: fffff8022506decf
BUGCHECK_P3: 1
BUGCHECK_P4: ffff8003d323b812
FILE_IN_CAB:  073125-225953-01.dmp
FAULTING_THREAD:  fffff8020f56d840
EXCEPTION_PARAMETER1:  0000000000000001
EXCEPTION_PARAMETER2:  ffff8003d323b812
WRITE_ADDRESS: Unable to get NonPagedPoolStart
Unable to get NonPagedPoolEnd
Unable to get PagedPoolStart
Unable to get PagedPoolEnd
 ffff8003d323b812
BLACKBOXBSD: 1 (!blackboxbsd)
BLACKBOXPNP: 1 (!blackboxpnp)
CUSTOMER_CRASH_COUNT:  1
BUGCHECK_CODE: Blue screen error codeBUGCHECK_P1 - P4: Four parameters passed to the system crash handler during blue screen; professionals can use these to more precisely locate issues;FAULTING_THREAD: Thread ID being executed during blue screen;
HEX data has been removed here and lines have been numbered;
STACK_TEXT:
1 : nt!KeBugCheckEx
2 : nt!KiFatalExceptionHandler+0x22
3 : nt!RtlpExecuteHandlerForException+0xf
4 : nt!RtlDispatchException+0x430
5 : nt!KiDispatchException+0x144
6 : nt!KiExceptionDispatch+0xc2
7 : nt!KiPageFault+0x42e
8 : dxgkrnl!DXGADAPTER::PowerRuntimeComponentActiveCallback+0x193
9 : dxgkrnl!DxgkPowerRuntimeComponentIdleCallback+0x46
10: nt!PopFxIdleWorker+0x7f
11: nt!PopFxIdleComponent+0x105
12: nt!PoFxIdleComponent+0xe
13: dxgkrnl!DXGADAPTER::ProcessComponentIdleList+0x150
14: dxgkrnl!DxgkpComponentIdleListTimerDpc+0xc
15: nt!KiProcessExpiredTimerList+0x159
16: nt!KiRetireDpcList+0x4a7
17: nt!KiIdleLoop+0x5a
STACK_TEXT is a textual representation of the call stack. It shows the functions the CPU was executing at the moment of crash, and which functions called them in sequence, tracing back to the thread's origin.
In this example, the most important lines are 7, 8, and 9; this issue was caused by dxgkrnl; dxgkrnl is the DirectX Graphics Kernel driver;
PROCESS_NAME:  System
SYMBOL_NAME:  dxgkrnl!DXGADAPTER::PowerRuntimeComponentActiveCallback+193
MODULE_NAME: dxgkrnl
IMAGE_NAME:  dxgkrnl.sys
IMAGE_VERSION:  10.0.17763.1971
FAILURE_BUCKET_ID:  AV_W_dxgkrnl!DXGADAPTER::PowerRuntimeComponentActiveCallback
The most critical part of the report, containing:
PROCESS_NAME: If the blue screen was triggered by a user-mode process, this shows the process name;SYMBOL_NAME: Symbol information corresponding to the faulting instructionMODULE_NAME, IMAGE_NAME: Module name; if a.sysfilename is directly shown, it's likely the culprit;FAILURE_BUCKET_ID: A unique identifier Microsoft uses to automatically categorize and track similar errors in their database. Searching this ID online may yield official solutions or users with the same issue;
Solutions
You can get a general idea of which process or driver caused the issue by analyzing the BUGCHECK_CODE, PROCESS_NAME, MODULE_NAME, and IMAGE_NAME information in the report. Uninstalling the problematic driver and installing the latest version from the official website will likely resolve the issue.
You can also search for the information provided in the FAILURE_BUCKET_ID field to see if Microsoft offers an official solution for this problem or to find others who have encountered the same issue.